

I feel the need, the need for speed!
In this post I want to speak directly to Page Speed and how Google Analytics can help. Several years ago, Google released a tool named Google Insights that will analyze a page for your site and provide suggestions to improve the speed of the web to the viewer.
Well Google Analytics takes it a step further by delivering those same results, but more importantly, GA can prioritize the results based on page views, bounce rate, % Exit, and Page Value. You can find this gem under Behavior > Site Speed. Under the Overview, you get a nice summary on how well your website is doing on average:
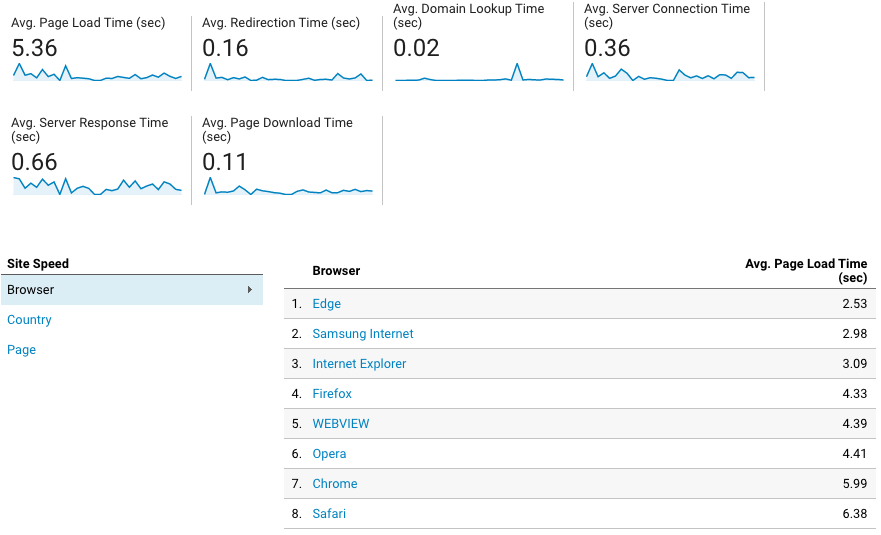 Figure 1. Sample Site Speed Report
Usability standards state that page load times should be under 3 seconds, else it is far more likely that a user will bounce - we just don’t have the patience anymore to wait on a slow loading website. This site is not good, but it’s not the worst I’ve seen while finding sample data for this newsletter.
What’s my takeaway from the above data? That the server is plenty fast enough, and so is the Internet; the true culprit is the page rendering, or how quickly it takes the browser to paint the screen. We’ll see why here shortly.
If I click one option down on the Google Analytics menu to Page Timings, here’s where I can get the summary to determine what my priorities are in fixing the site speed.
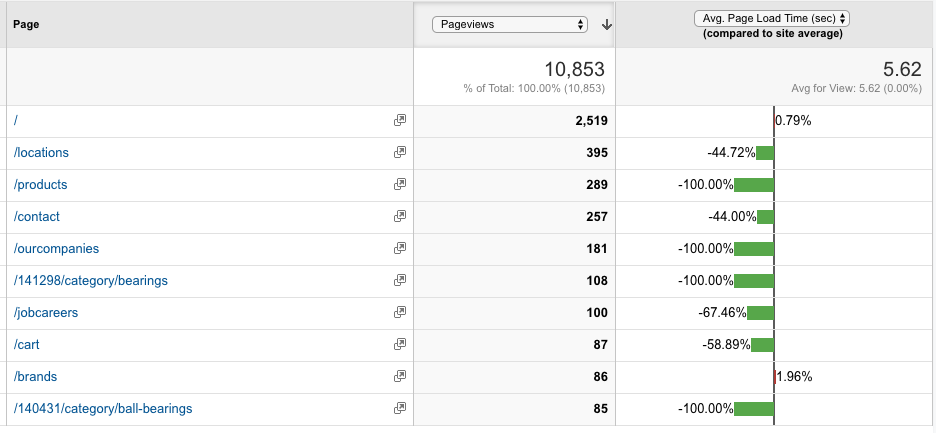 Figure 2. Sample Page Timings report.
This view is ranked by the number of page views, or how popular the pages are to all visitors. The most popular pages are not contributing the overall 5.62s average. If I expand the results past 10, I see the first hiccup:
 Figure 3. First indication of a problem.
This is saying this particular category page takes on average 50% slower than the site average, or 8.4 seconds to render. Here is a good candidate for Google Insights. But I prefer the shotgun method. Let’s take out 96% of the problems and then clean up the remaining 4% to gain maximum efficiency.
Here’s the same report rendered by page load speed averages instead:
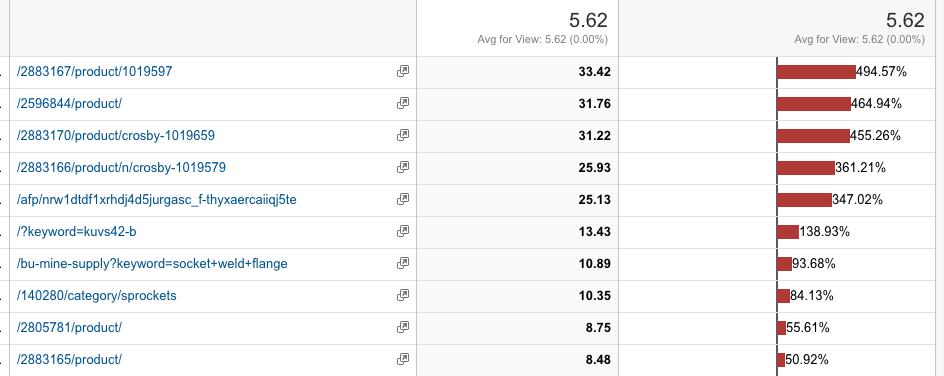 Figure 4. Our worst performing pages.
Yikes, our worst performer is a product page that takes nearly 33 seconds to render. All of these are great candidates for Google Insights as they are a mixture of product pages, category pages, and search result pages. Chances are if you clean up one of them, the other type pages will also see speed gains.
Before I go to the next section, I do want to mention you can rank each of the pages by Pageviews, Page Load Times, Bounce Rate, % Exit and Page Value. This can help prioritize where you are going to fix your speed. So what can you do to do that?
That’s where the third option, Speed Suggestions, comes into play.
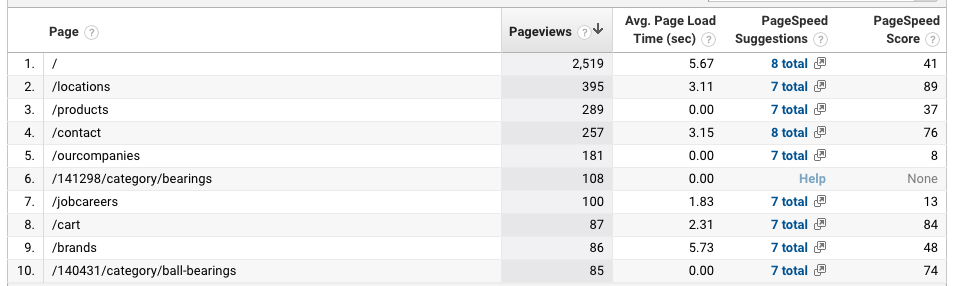 Figure 5. Speed Suggestions.
Based upon the URL, Google has already ran the Google Insights report on those pages for you, collected the speed suggestions, and provided a page scored. 0-49 is red, 50-89 is yellow, 90-100 is green. For this site, there are no green pages, four yellow pages, and 5 red pages in the top 10 by Page Views list.
If you click into the hyperlinks under Speed Suggestions, you will be inundated with technical details, recommendations, and tables to increase your speed. Examples of what you will see are javascript libraries being compressed and minified, images not optimized for size or rendering, calls to third party tools like Hotjar before the pages are loaded, etc.
In the case for this site, page rendering is the problem:
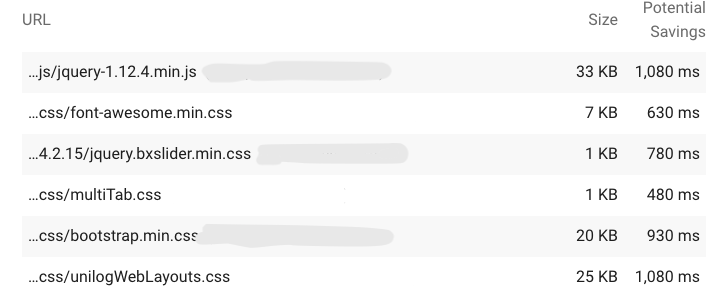 Figure 6. Speed Suggestions for Ball-Bearings Category Page.
Rendering the jQuery library and five style sheets at the end of the webpage document would result in an improvement of conservatively two full seconds - these assets are downloaded in parallel and cannot be cummulatively added. The remaining pieces of the suggestions are highly complex and are truly geared for your developers as the audience.
But know this, the takeaway here is that you can use Google Analytics to prioritize the page speed fixes based on Page Views, or negative indicators like Bounce Rate or Page Exit %. More than likely, your web platform is loading a preset list of libraries and objects for every page and fixing one page will trickle out to the other pages, too.
If you want to collect the URLs for the site and provide them to the developers, then they can run them individually through Google Insights at https://developers.google.com/speed/pagespeed/insights/ to receive the same speed suggestions you see within Google Analytics.
Last thing, how often should you perform this exercise? I conservatively say annually and anytime a major web component is added, removed, or updated. For example, if you are updating jQuery 2.2 to jQuery 3.1, then you should be running the Insights tool to make sure you are at or better on your site average. Another good time is to run it at the beginning of summer when business slows down and these maintenance tasks can quickly be accomplished between vacations.
Remember, if you need help setting up your Google Analytics, Tag Manager, and Search Engine projects (or installing Hotjar) please let me know. I’d love to help you with your website strategy.
Cheers!
Tags: analytics