

Originally posted January 14 on academy.b2xpartners.com
There are many different types of websites like Marketing Brochure, Social Networking, and Discussion Boards. If you do a Google search, you’ll find sites define anywhere from four to 15 different types; but in this discussion, I want to focus specifically on Lead Generation with respect to Analytics and KPIs.
Lead Generation websites are typically content focused to (1) rank high on the search engines to draw in new visitors to the website, and (2) provide value to the reader to entice them to provide their contact information, and thus become a customer lead.
The best KPI to measure a lead generation website is subscription rate. Given a period of time, how many guest users subscribed vs. guest user sessions will give you your “velocity”. Measure month over month or quarter over quarter to see your “acceleration”. Also, be mindful of which content, or landing page, is leading to your subscriptions and which is yielding zero subscriptions, then update your poor performers.
The goal is to collect some form of contact information, be it an email address, phone number, twitter handle. Remember, these conversions could happen offline, too, so measure how many times the phone number is clicked with a <tel: > tag and put collecting contact information high in your CSR call scripts.
A good secondary KPI is engagement, how many pages does each visitor visit per session. If you see your engagement metric hovering around 1, the visitor is bouncing and you know you need to work on your content to provide more value to your audience. If you have 25 pages, and your pageviews/session is 3, then you need to look at your internal linking strategy within your pages to help drive the visitors to more pages.
Every website has some form of marketing inherently built in as you try to convince a guest visitor to become a registered or known user. These simple metrics will help measure your efforts in increasing subscriptions and engagement.
Question: So, that KPI is very interesting and one that most Distributors or Mfg DO NOT track. Would you recommend this as an Executive level KPI to show Execs or just for the eCommerce team?
That’s a great question and I will answer with both! Mind you, all of these numbers are fictitious and may not make mathematical sense.
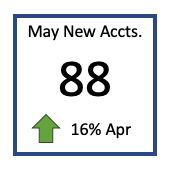
For the Executive Level KPI, I would put both Velocity and Acceleration on a dashboard to simply convey KPI growth or decline, ie.:
But for the eCommerce team, I would include more tactical information in tabular format, i.e.:
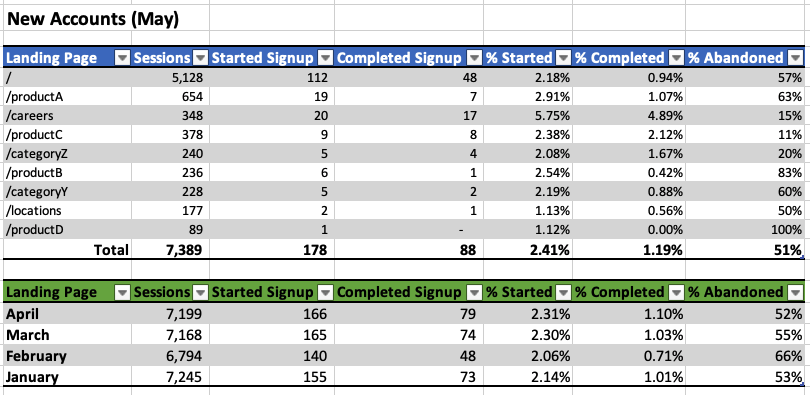
From here you can see recently that the careers page accounts for the most signups, presumably because the visitor is applying for an open position, but also that a large number of signups begin from ProductA, and your greatest abandonment is productB. Effort should be placed on product B to increase its conversion rate either through rewriting the page copy, adding supplemental information, and/or cleaning up the overall design of the product page.
Historically, other than February, conversion rate is steadily increasing while Sessions have been seemingly flat.
I would personally never present the table to an Executive because it is too complicated and the tendency is to try to “fix” every number to make it better - the message ends up lost. Providing direction is enough while the eCommerce team focuses on the low level numbers to continue increasing conversion rate.
Tags: analytics